DOCUMENTS
MAPS
|
Fire Risk Perception Interpolation
Fire Risk Perception Hot Spot Analysis
|
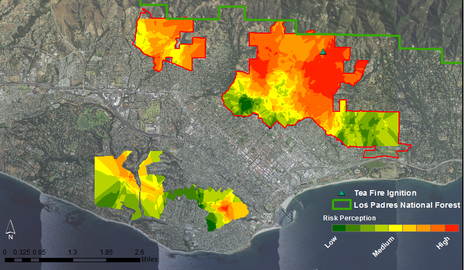
To determine the collective risk perception for geographic areas in the foothill and extreme foothill zones, as well as the coastal zones of the high fire hazard areas, we used interpolation of survey responses. To do this, we used the perceived fire risk responses, including non-respondents, to perform the Kriging method of interpolation in ArcGIS. We believed a Kriging analysis would be appropriate for this interpolation since there is a correlated distance or directional bias in our data. Based on the location of our data points and the nature of the data collected from each point, we chose to use a spherical semivariogram with ordinary kriging.
As one might expect, the Kriging analysis showed that areas near the Los Padres National Forest border, the Tea Fire ignition location, and areas near densely vegetated canyons all had higher perceived risk estimates. |
|
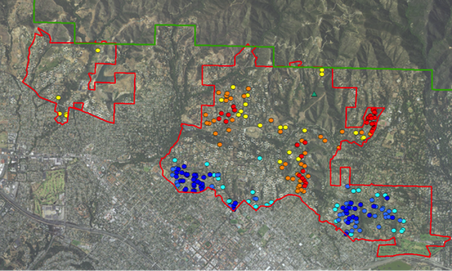
After the Kriging analysis determined areas of low-to-high perceived fire risk, we identified statistically significant hot spots and cold spots. Using the “Hot Spot Analysis (Getis-Ord Gi*)” tool in ArcGIS. Points that were determined to be statistically significant hot spots were points that had a high risk value and were surrounded by other high risk value points. The same goes for the cold points and low risk values. The local sum for a point and its neighbors is compared proportionally to the sum of all features. If the local sum varies largely from the expected local sum, then the feature is a statistically significant hot (area of high risk perception) or cold spot (area of low risk perception).
We found two large cold spots within the District, both of which fell in the Southern region - farthest from the Los Padres National Forest boundary line (Figure 7). The residents within these areas are clearly unaware of the actual fire risk in their neighborhoods, likely due to their homes being farther from the mountains and therefore appearing to be at less of a risk than those in the extreme foothill zones. The hotspot analysis shows key areas that the Fire Department should target for increased and enhanced communication efforts. |
